點狀資訊KML檔之撰寫(csv2kml.py)
Table of contents
背景
- 點狀資訊在KML架構中是最單純的。KML提供了點狀性質(feature)的設定方式,因此使得單調的點,因著背景地圖的參考而變得豐富。
- [csv2kml.py]的應用有很多,繪製軌跡圖、將點狀(與鏈結)資訊輸出到uMAP展現、貼在openTopo底圖(NCLonOTM)、ISC/AERMOD地理資訊的解讀展示等等。
- 如果要建立更複雜的KML,由熟悉點狀資訊的輸出,會是一個好的開始。
前言
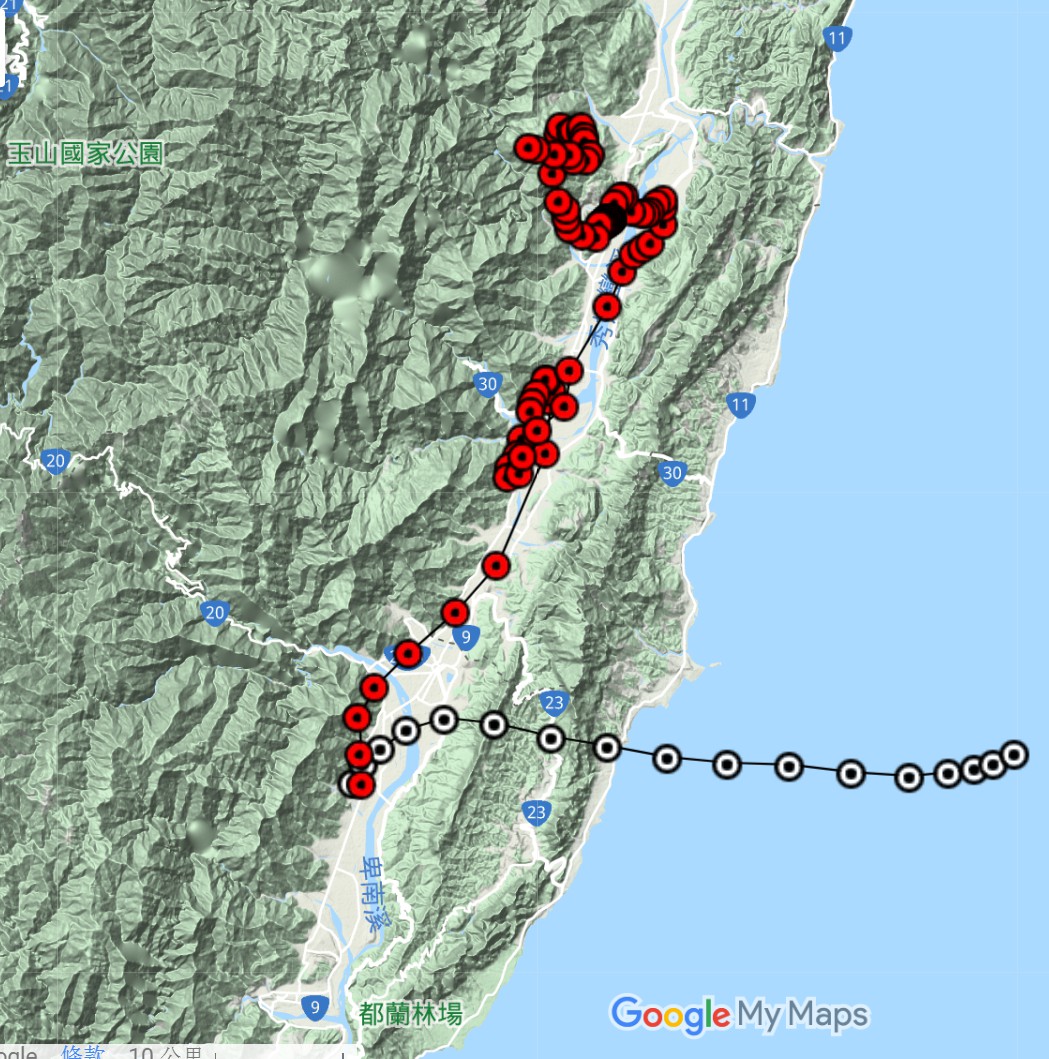
csv是常見的資料表格式,KML則是google提供的語言介面,好讓使用者也可以在google map上貼圖,現已成為開放式地理空間協會地理資訊的編碼標準。 因此csv2kml顧名思義就是嘗試把一個存有座標的csv檔案,寫成kml檔案,最終能貼在google map、openstreet map等網路地圖上,完成這項工作的python小程式。(成果如附圖)
 |
|---|
| csv2kml結果範例 |
- 輸入部分重點在於應用pandas模組來開啟csv檔案,呼叫csv的內容。其次則為處理命令列選項的模組argparse,這2者都是python資料處理常用的模組。
- 輸出部分是本程式的重點。主要參考KML官網的介紹,將要繪製的內容、點、線等元素,依據KML的順序寫出,以符合google map程式的規則。KML(Keyhole Markup Language)及其zip後的檔案格式KMZ,是google map/google earth平台上特有的檔案格式,詳細介紹可以參考官網及網友的說明。大致上KML語法和html相同,除了一般性的格式之外,在地圖上標示的元件以
… 做為起迄標示。而在本作業中乃是以LineString、Point 為繪圖形式,此外KML也有Path、Polygon(shaded色塊) 等形態。 - 處理計算部分google map用的是經緯度系統,台灣地區常用的是TWD97系統,如果使用後者,需要進行座標轉換。此處使用twd97模組。
KML格式及內涵
- KML的內容可以參考其教學網站。如果只需要輸出單一分開的功能,可以考慮simplekml模組。 範例圖檔(紅色部分)為如下共276行之kml檔案,kml並不需要跳行,純粹是為了閱讀解釋方便才加上跳行指令(‘\n’),其內容說明如下:
起始
在此說明整個檔案會用到的宣告,包括
- 開啟kml 及Document之宣告
- 名稱name(會出現在google map的圖名標籤)(line 1)
- 敘述說明descri(line 1)
- 可能會用到的圖像定義Icon(line2~6),是用style id 來定義並呼叫,範例呼叫了紅點reddotPlacemark。
- icon選擇的考量:
$ cat -n trjguanshan2019062315.csv.kml
     1  <?xml version="1.0" encoding="UTF-8"?><kml xmlns="http://www.opengis.net/kml/2.2"><Document><name>trjguanshan2019062315.csv</name><descri ption>trjguanshan2019062315.csv</description>
     2  <Style id="normalPlacemark"><IconStyle><Icon><href>http://maps.google.com/mapfiles/kml/paddle/</href>wht-blank.png</Icon> </IconStyle></Style>
     3  <Style id="highlightPlacemark"><IconStyle><Icon><href>http://maps.google.com/mapfiles/kml/paddle/red-stars.png</href> </Icon> </IconStyle></Style>
     4  <Style id="dotPlacemark"><IconStyle><Icon><href>http://maps.google.com/mapfiles/kml/pal4/icon57.png</href> </Icon> </IconStyle></Style>
     5  <Style id="blackdotPlacemark"><IconStyle><Icon><href>http://maps.google.com/mapfiles/kml/pal4/icon25.png</href> </Icon> </IconStyle></Style>
     6  <Style id="reddotPlacemark"><IconStyle><Icon><href>http://maps.google.com/mapfiles/kml/pal4/icon49.png</href> </Icon> </IconStyle></Style>
     7  <Placemark><name>hour=0</name><description>ymd=2019062315</description><styleUrl>#reddotPlacemark</styleUrl><Point><coordinates>
     8  121.16166338764377,23.04499756226396,0</coordinates></Point></Placemark>
     9  <Placemark><name>hour=1</name><description>ymd=2019062314</description><styleUrl>#reddotPlacemark</styleUrl><Point><coordinates>
    10  121.16052210969468,23.06644148767801,0</coordinates></Point></Placemark>
    11  <Placemark><name>hour=2</name><description>ymd=2019062313</description><styleUrl>#reddotPlacemark</styleUrl><Point><coordinates>
    12  121.15857390654217,23.090818981273667,0</coordinates></Point></Placemark>
    13  <Placemark><name>hour=3</name><description>ymd=2019062312</description><styleUrl>#reddotPlacemark</styleUrl><Point><coordinates>
    14  121.17029256991134,23.110768605923834,0</coordinates></Point></Placemark>
...
   181  <Placemark><name>hour=87</name><description>ymd=2019062000</description><styleUrl>#reddotPlacemark</styleUrl><Point><coordinates>
   182  121.28943947883455,23.47345566850706,0</coordinates></Point></Placemark>
   183  <Placemark><name>hour=88</name><description>ymd=2019061923</description><styleUrl>#reddotPlacemark</styleUrl><Point><coordinates>
   184  121.28348218711278,23.475183559469606,0</coordinates></Point></Placemark>
   185  <Placemark> <LineString> <coordinates>
   186  121.16166338764377,23.04499756226396,0
   187  121.16052210969468,23.06644148767801,0
   188  121.15857390654217,23.090818981273667,0
   189  121.17029256991134,23.110768605923834,0
   190  121.19588315665499,23.134448977175694,0
   191  121.23013239723322,23.161453958196724,0
...
   274  121.28348218711278,23.475183559469606,0
   275  </coordinates></LineString></Placemark>
   276  </Document></kml>
直線段落
第3段(line185~275)為範例圖檔中的「線」(LineString)。「線」指令會將給定座標的第1點開始,按照順序連接所有的座標點,直到最後1點。
    33  df=read_csv(fname)#,encoding='big5')
    47  col=df.columns
    50  for i in range(len(df)):
    51    nam=df.loc[i,col[2]]
    52    desc=df.loc[i,col[3]]
    55    if TWD97:
    56      x,y=df.loc[i,col[0]],df.loc[i,col[1]]
    57      lat,lon=twd97.towgs84(x,y)
    58    if LL:
    59      lon,lat=df.loc[i,col[0]],df.loc[i,col[1]]
座標轉換計算
- twd97
- 網友公開的twd97模組,其計算結果與學術單位網站服務所差小於1M
- 在119~121範圍內有效,其外結果則不保證。
多邊形的應用
基本
- 同樣2點以上的數據,可以用點(Point)或線(Line)形式來繪製KML的地標(Placemark)
- 4點以上,如果最後點與第一點重疊,則可以選擇以多邊形來展現地標,多邊形的特性就是除了線條之外,也可以針對填滿的顏色、透明度等進行設定。
- 等值圖KML檔之撰寫就是以具有順序的多邊形、來層疊出等值圖的特性。
多邊形的特殊約定
- 由於多邊形物件不限定點數,因此必須(至少)約定物件的開始點。
- 此處在df.desc內容中約定含有’p0’字串者,為該物件的第一筆,如此就可以正確切割csv檔案成為所要的多邊形群組,同時保有原來csv檔的單純性。
...
else: #Polygon case
  headP = '</styleUrl><Polygon><outerBoundaryIs><LinearRing><tessellate>1</tessellate><coordinates>'
  tailP = '</coordinates></LinearRing></outerBoundaryIs></Polygon></Placemark>'
  ps=[i[-2:] for i in list(df[col[3]])]
  npoly,i0,i1=1,[0],[len(df)]
  if 'p0' in ps:
    npoly=ps.count('p0')
    if npoly>1:
      i1=[]
      for i in range(npoly-1):
        i0.append(i0[-1]+1+ps[i0[-1]+1:].index('p0'))
        i1.append(i0[-1])
      i1.append(len(df))
  for ip in range(npoly):
#   level=int(np.random.rand()*10)
    level=5
    nam=df.loc[i0[ip],col[2]].replace('p0','')
    desc=df.loc[i0[ip],col[3]].replace('p0','')
    line.append('<Placemark><name>' + nam + '</name><description>'+desc+'</description><styleUrl>#level' + str(level) + headP)
    print (i0[ip],i1[ip])
    for i in range(i0[ip],i1[ip]):
      line.append(lonlat[i])
    line.append(tailP)
...
程式說明
csv2kml.py 程式碼
調用模組與引數之讀取
在命令列鍵入引數, python常用的讀取方式有2種,一者為簡易的sys.argv指令,另外最常使用的則是其內設的引數解析argparse模組。前者沒有help、不會解析引數的型態,一律為字串。相對而言,後者的功能就較為完整、足供應用了。使用argparser讓引數的種類可以多元化
本程式所需的引數有3個,分別為:
- -f(csv檔案名稱)、
- -n(點線型態的選擇、有N白色地點、H紅色地點、D細線圓點、R紅色圓點、B黑色暈點,再加L繪線、G則告訴程式csv的內容為多邊形 )
- -g座標系統有TWD97及LL 等2個選項
- LL為經緯度
- TWD97為台灣地區2度分帶97年基準座標
程式語法以add_argument()來接收命令列訊息。
- 必要的選項有2,選項代碼(短名)、選項長名、
- 其他補充的選項包括是否必須(required)、引數的類型、以及說明內容。
- 在呼叫時以3個元素的tuple來承接(line 16),其順序即為檔名、點線特性、以及座標系統種類。
$ cat -n ~/bin/csv2kml.py
     1  #!/cluster/miniconda/envs/py37/bin/python
     2  from pandas import *
     3  import twd97,sys
     4
     5
     6  def getarg():
     7      """ read the setting of plot from argument(std input)"""
     8      import argparse
     9      ap = argparse.ArgumentParser()
    10      ap.add_argument("-f", "--fname", required = True, type=str,help = "csv xy data")
    11      ap.add_argument("-n", "--NorH", required = True, type=str,help = "Normal/Highlight/Dot/Reddot/Blackdot w/o Line")
    12      ap.add_argument("-g", "--GEOG", required = True, type=str,help = "LL or TWD9")
    13      args = vars(ap.parse_args())
    14      return args['fname'],args['NorH'],args['GEOG']
    15
定義座標種類
- 標示方式可以是
- H:Hightlight Baloon
- N:Normal Baloon
- D: Dots
- R: Red Dots
- B: Black Corona
    16  fname,NorH,geog=getarg()
    17  NorH,geog=NorH.upper(),geog.upper()
    18  LL,TWD97=False,False
    19  if geog=='LL':
    20    LL=True
    21  if geog=='TWD97':
    22    TWD97=True
    23  if NorH[0] not in ['H', 'N', 'D','R','B'] :sys.exit('NorH not right')
    24  NH=NorH.replace('L','')
    25
    26  #B:target with black arona
    27  #R:red target
    28  #D:dot target
    29  stl={'N':'normalPlacemark','H':"highlightPlacemark",'D':"dotPlacemark",'B':"blackdotPlacemark",'R':"reddotPlacemark"}
    30  #csv with 4 columns,
    31  #xp,yp,Hour,ymdh
    32  #266567.0,2549275.0,hour=0,ymd=2019062315
pandas之應用
- python讀取ASCII資料一般也有2種方式,一者開啟檔案後直接讀取(with open(fname,’r’) as file:;data=[l for l in file]),讀出來的內容一律是字串(含跳行指令’\n’),還必須另外分段、解析、給予型態定義。
- 另一方式則以pandas來讀取。在解析上方便太多。以一般具有表頭(header)、逗點分隔(delimitor)的csv檔而言,讀取指令最簡單如line 33所示。如果不是,也可以在一行內解決設定。
- python 3必須指定coding,python 2 則不需要
- pandas的資料結構(dataframe)具有陣列處理的功能,具有平行計算的能力,然本範例中仍然當成序列循續處理,也有淺顯易懂的好處。
- df.columns:讀取表頭成為一序列
- df.loc[i,j]:讀取資料表中i列(i為數字), j欄的內容(前述表頭欄位名稱之一)。
    33  df=read_csv(fname)#,encoding='big5')
    34  TITLE=fname
KML檔頭與標點
- 檔頭除了標示kml版本之外,也宣告了標點、線條的樣式
    35  head0='<?xml version="1.0" encoding="UTF-8"?><kml xmlns="http://www.opengis.net/kml/2.2"><Document>'+ \
    36  '<name>'+TITLE+'</name><description>'+TITLE+'</description>'
    37  #store the lines
    38  line=[head0]
    39
    40  #icons may be used in KML file:
    41  sty_pngs={'H':'paddle/red-stars.png','N':'paddle/white-stars.png','B':'pal4/icon25.png','D':'pal4/icon57.png','R':'pal4/icon49.png',}
    42  for s in stl:
    43    stl_url='<Style id="'+stl[s]+'"><IconStyle><Icon><href>http://maps.google.com/mapfiles/kml/'+sty_pngs[s]+'</href> </Icon> </IconStyle></Style>'
    44    exec('styl'+s+"='"+stl_url+"'")
    45    exec('line.append(styl'+s+')')
    46
計算經緯度
- 使用twd97模組
- 輸出時經緯度及高度間以逗點隔開
    47  col=df.columns
    48  lonlat=[]
    49  #plot the placemarks
    50  for i in range(len(df)):
    51    nam=df.loc[i,col[2]]
    52    desc=df.loc[i,col[3]]
    53    sturl= '<styleUrl>#'+stl[NH]+'</styleUrl>'
    54    line.append('<Placemark><name>'+nam+'</name><description>'+desc+'</description>'+sturl+'<Point><coordinates>')
    55    if TWD97:
    56      x,y=df.loc[i,col[0]],df.loc[i,col[1]]
    57      lat,lon=twd97.towgs84(x,y)
    58    if LL:
    59      lon,lat=df.loc[i,col[0]],df.loc[i,col[1]]
    60    slonlat=str(lon)+','+str(lat)+',0'
    61    line.append(slonlat+'</coordinates></Point></Placemark>')
    62    lonlat.append(slonlat)
    63
附加軌跡線數據及檔尾
- 關鍵詞為
- 順序是軌跡線的經度、緯度、高度(0),跳行指令不一定需要。
    64  #if with L in NorH, connection the marks with line
    65  if 'L' in NorH:
    66    line.append('<Placemark> <LineString> <coordinates>')
    67    for i in range(len(df)):
    68      line.append(lonlat[i]+'\n')
    69    line.append('</coordinates></LineString></Placemark>')
    70  line.append('</Document></kml>')
輸出KML檔案
- 基本上KML是一個文字檔,因此使用open.write指令即可將其寫出
    71  with open(fname+'.kml','w') as f:
    72    [f.write(l) for l in line]
Reference
- 名詞解釋
- ASCII(American Standard Code for Information Interchange,美国信息交换标准代码) https://zh.wikipedia.org/wiki/ASCII
- KML(Keyhole Markup Language Keyhole公司標記語言),wiki
- TWD97, 大地座標系統漫談, sunriver.com
- argparse
- pandas
- Pandas 基礎教學
- 10 minutes to pandas
- 資料科學家的 pandas 實戰手冊:掌握 40 個實用數據技巧
- KML and icons
- KML Samples - Google Developers
- KML Tutorial
- Google+Map讀取KML檔
- 在 Google 地球中匯入 KML 地圖資料 google support
- simplekml, pypi ;readthedoc
- google提供的icons
- twd97