gridded land cover/land use
Table of contents
背景
- GISGeography蒐集了全球LCLU
- USGS的FAQ:Where can I get global land cover data?
- Scanlon, B., Jolly, I., Sophocleous, M., and Zhang, L. (2007). Global Impacts of Conversions From Natural to Agricultural Ecosystems on Water Resources: Quantity Versus Quality. Water Resour. Res 43. doi:10.1029/2006WR005486.
- Global distribution of land cover based on MODIS (1 km) satellite data using International Geosphere Biosphere Program land cover classes prepared by Boston University (Earth Observing System (EOS) Data Gateway, Cropland (2%) refers to cropland/natural vegetation mosaic.
Irrigation
- 42種作物有一半是旱作、一半是灌溉,影響資料結構甚巨。
MODIS對照到USGS分類時無法明確對照出是否為旱作或灌作,即使USGS也是用其他因素來辨識。可知灌作之確認確實有其困難。
- Ozdogan, M. and Gutman, G. (2008). A new methodology to map irrigated areas using multi-temporal MODIS and ancillary data: An application example in the continental US. Remote Sensing of Environment 112:3520–3537. doi:10.1016/j.rse.2008.04.010.
- Moderate Resolution Imaging Spectroradiometer (MODIS) Irrigated Agriculture Dataset for the United States (MIrAD-US), USGS
- Pervez MS, Brown JF. Mapping Irrigated Lands at 250-m Scale by Merging MODIS Data and National Agricultural Statistics. Remote Sensing. 2010; 2(10):2388-2412. https://doi.org/10.3390/rs2102388.
- Global irrigation areas (2001 to 2015)GEE-COMMUN-DATASET
- Deepak Nagaraj, Eleanor Proust, Alberto Todeschini, Maria Cristina Rulli, Paolo D’Odorico, A new dataset of global irrigation areas from 2001 to 2015, Advances in Water Resources, Volume 152,2021,103910,ISSN 0309-1708,https://doi.org/10.1016/j.advwatres.2021.103910.
- Iternationl Water Management Institute, Global Irrigated Area Mapping, Aprial 25, 2014
- 28 種灌溉狀態,詳AVHRR NDVI (1999)
| number | Irr | source | #crops | crop cat. | Single Crop | Double Crop | continuous crop | |
|---|---|---|---|---|---|---|---|---|
| 01 | Irrigated, | surface water, | single crop, | wheat-corn-cotton | Mar-Nov | |||
| 02 | Irrigated, | surface water, | single crop, | cotton-rice-wheat | Apr-Oct | |||
| 03 | Irrigated, | surface water, | single crop, | mixed-crops | Mar-Oct | |||
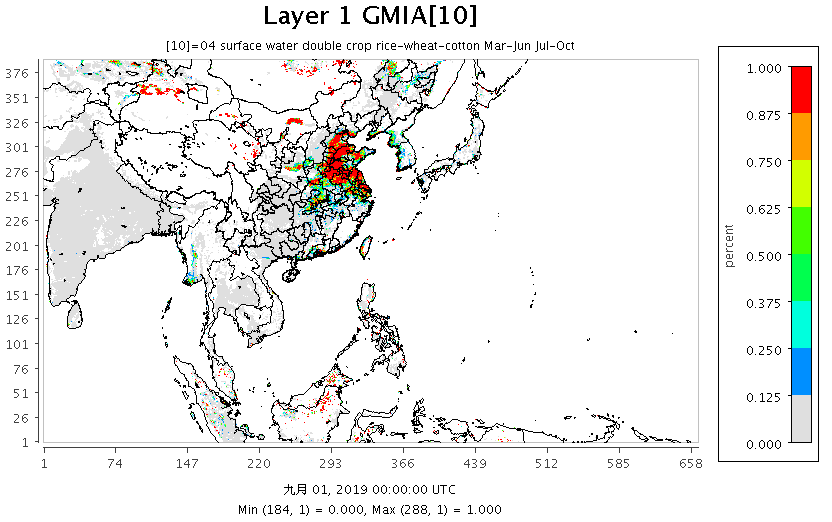
| 04 | Irrigated, | surface water, | double crop, | rice-wheat-cotton | Mar-Jun Jul-Oct | |||
| 05 | Irrigated, | surface water, | double crop, | rice-wheat-cotton-corn | Jun-Oct Dec-Mar | |||
| 06 | Irrigated, | surface water, | double crop, | rice-wheat-plantations | Jul-Nov Dec-Mar | |||
| 07 | Irrigated, | surface water, | double crop, | sugarcane | Jun-Nov Dec-Feb | |||
| 08 | Irrigated, | surface water, | double crop, | mixed-crops | Jul-Nov Dec-Apr | |||
| 09 | Irrigated, | surface water, | continuous crop, | sugarcane | Jul-May | |||
| 10 | Irrigated, | surface water, | continuous crop, | plantations | Jan-Dec | |||
| 11 | Irrigated, | ground water, | single crop, | rice-sugarcane | Jul-Dec | |||
| 12 | Irrigated, | ground water, | single crop, | corn-soybean | Mar-Oct | |||
| 13 | Irrigated, | ground water, | single crop, | rice and other crops | Mar-Nov | |||
| 14 | Irrigated, | ground water, | single crop, | mixed-crops | Jul-Dec | |||
| 15 | Irrigated, | ground water, | double crop, | rice and other crops | Jul-Nov Dec-Mar | |||
| 16 | Irrigated, | conjunctive use, | single crop, | wheat-corn-soybean-rice | Mar-Nov | |||
| 17 | Irrigated, | conjunctive use, | single crop, | wheat-corn-orchards-rice | Mar-Nov | |||
| 18 | Irrigated, | conjunctive use, | single crop, | corn-soybeans-other crops | Mar-Oct | |||
| 19 | Irrigated, | conjunctive use, | single crop, | pastures | Mar-Dec | |||
| 20 | Irrigated, | conjunctive use, | single crop, | pasture, wheat, sugarcane | Jul-Feb | |||
| 21 | Irrigated, | conjunctive use, | single crop, | mixed-crops | Mar-Nov | |||
| 22 | Irrigated, | conjunctive use, | double crop, | rice-wheat-sugar cane | Jun-Nov Dec-Mar | |||
| 23 | Irrigated, | conjunctive use, | double crop, | sugarcane-other crops | Apr-Jul Aug-Feb | |||
| 24 | Irrigated, | conjunctive use, | double crop, | mixed-crops | Jul-Nov Dec-Feb | |||
| 25 | Irrigated, | conjunctive use, | continuous crop, | rice-wheat | Mar-Feb | |||
| 26 | Irrigated, | conjunctive use, | continuous crop, | rice-wheat-corn | Jun-May | |||
| 27 | Irrigated, | conjunctive use, | continuous crop, | sugarcane-orchards-rice | Jun-May | |||
| 28 | Irrigated, | conjunctive use, | continuous crop, | mixed-crops | Jun-May |
- transform the tiff file into csv(only save value>0)
import rasterio
import numpy as np

fname='giam_28_classes_global.tif'
img = rasterio.open(fname)
nx,ny,nz=img.width,img.height,img.count
dx,dy=360./(nx-1),180./(ny-1)
lon_1d=[-180+dx*i for i in range(nx)]
lat_1d=[90-dy*i for i in range(ny)]
data=img.read()
lonm, latm = np.meshgrid(lon_1d, lat_1d)
idx=np.where(data>0)
DD={'lon':lonm[idx[1],idx[2]],'lat':latm[idx[1],idx[2]],'irr':data[0,idx[1],idx[2]]}
df=DataFrame(DD)
df.set_index('lon').to_csv('irr.csv')
- transform the coordinates
import numpy as np
import netCDF4
from pyproj import Proj
from scipy.interpolate import griddata

Latitude_Pole, Longitude_Pole = 23.61000, 120.9900
pnyc = Proj(proj='lcc', datum='NAD83', lat_1=10, lat_2=40,lat_0=Latitude_Pole, lon_0=Longitude_Pole, x_0=0, y_0=0.0)
fname='temp.nc'
nc = netCDF4.Dataset(fname, 'r+')
V=[list(filter(lambda x:nc.variables[x].ndim==j, [i for i in nc.variables])) for j in [1,2,3,4]]
nt,nlay,nrow,ncol=(nc.variables[V[3][0]].shape[i] for i in range(4))

#d00範圍:北緯-10~50、東經60~180。'area': [50, 60, -10, 180,],
boo=(df.lon>=60)&(df.lon<=180)&(df.lat>=-10)&(df.lat<=50)
df1=df.loc[boo].reset_index(drop=True)
x,y=pnyc(list(df1.lon),list(df1.lat), inverse=False)
x,y=np.array(x),np.array(y)
df1['ix']=np.array((x-nc.XORIG)/nc.XCELL,dtype=int)
df1['iy']=np.array((y-nc.YORIG)/nc.YCELL,dtype=int)
df2=df1.loc[(df1.ix>=0)&(df1.ix<ncol)&(df1.iy>=0)&(df1.iy<nrow)].reset_index(drop=True)
df2['ixy']=[str(i)+'_'+str(j) for i,j in zip(df2.ix,df2.iy)]
df2['ixyr']=[i+'_'+str(j) for i,j in zip(df2.ixy,df2.irr)]
pv=pivot_table(df2,index='ixyr',values='irr',aggfunc='count').reset_index()
var=np.zeros(shape=(nlay,nrow,ncol))
for n in range(len(pv)):
  ixy=pv.loc[n,'ixyr']
  ix,iy,ir=(int(i) for i in ixy.split('_'))
  var[ir,iy,ix]=pv.loc[n,'irr']
svar=np.sum(var,axis=0)
a=np.where(svar<255,svar,255) #255=15*15
nc[V[3][0]][0,:,:,:]=var[:,:,:]/a[None,:,:]
nc[V[3][0]][0,0,:,:]=a[:,:]
nc.close()
- notes
- griddata interpolation will take very long time, spare the zero values and aggregate, not interpolate.
- do loop along the df2 axis is also taken time, use pivot_table instead
results
 |
|---|
| 圖 d01範圍第4類灌溉面積的佔比(%) |
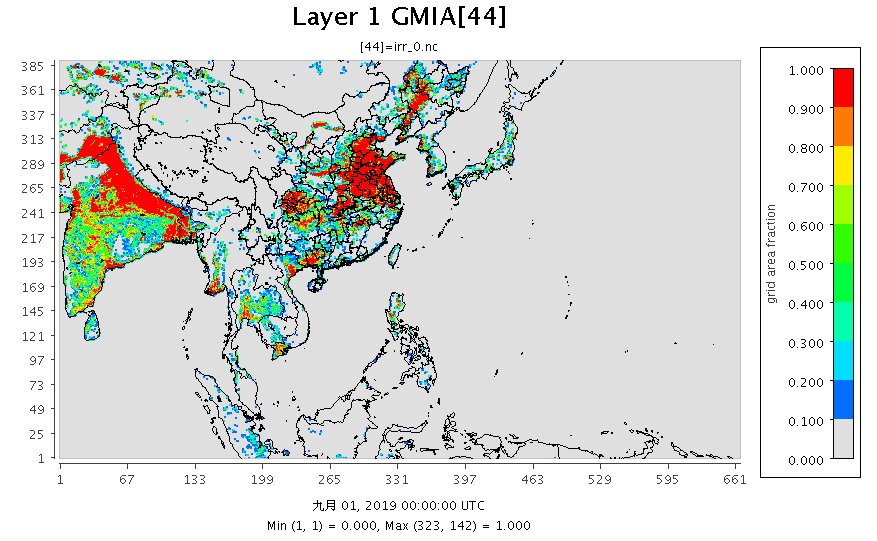 |
| 圖 d01範圍所有種類灌溉面積的佔比(%) |
land use/land cover map
- 此處直接解讀GISGeography的全球LCLU數據tiff.rar。
- NXNY=(40457,20188),解析度約1Km,採合併方式轉換座標系統。
Definition
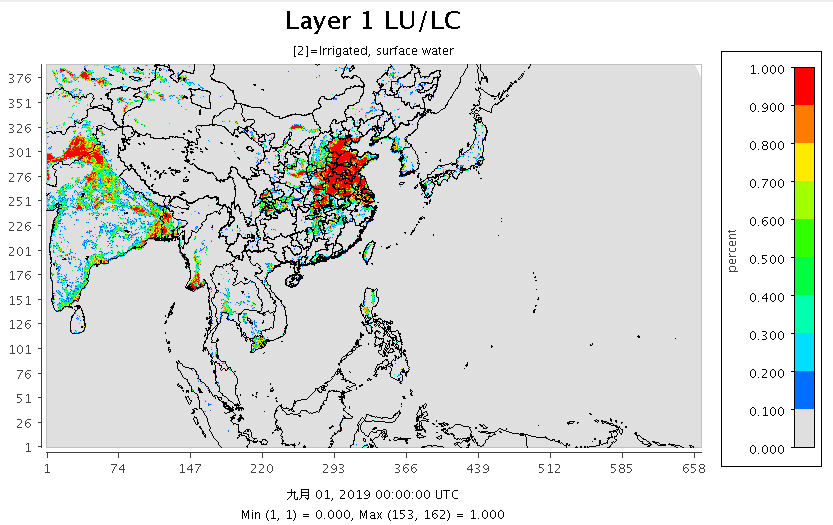
- Irrigated, surface water
- Irrigated, Groundwater/Conjuctive Use
- Rainfed Croplands
- Rainfed Croplands and Grasslands/Shrublands
- Natural Vegitation with Rainfed Fragments
- Forest(Mixed)
- Savvana, Grasslands, Shrublands
- Barren Lands, Deserts or Sparse Vegetation
- Snow, Ice, Tundra
- Water Body
Python
- same as irrigation map, but nlay=11
Results
 |
|---|
| 圖 d01範圍第1類土地使用/植被(地面水灌溉)面積的佔比(%) |
| ![barren].PNG](/Focus-on-Air-Quality/assets/images/barren.PNG) |
| 圖 d01範圍第8類土地使用/空曠、沙漠或植被稀疏地的面積佔比(%) |
- see also