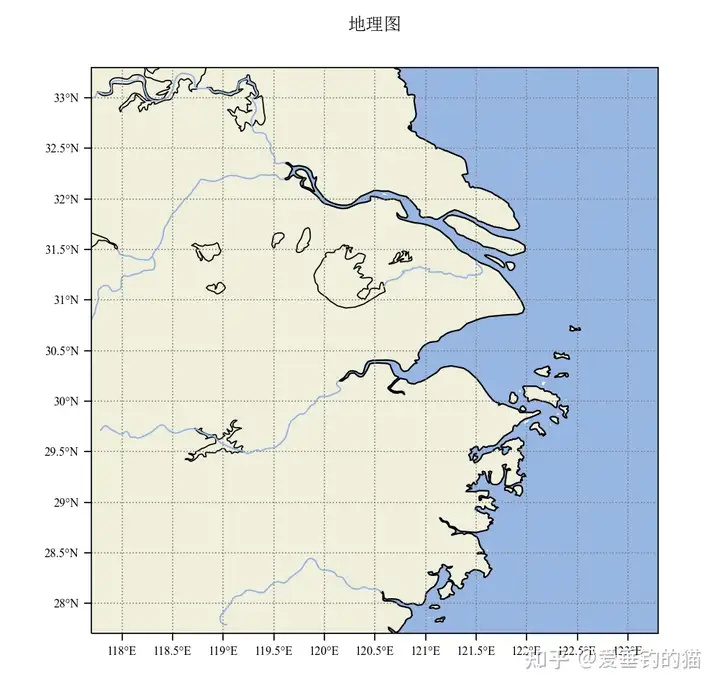
地圖之經緯度格線

Table of contents

背景

  • 這一題之所以會變得重要,是因為wrf-python官網對gridlines()的用法語焉不詳。
    • 一般情況程式上能自動設定,結果也尚可接受,但遇到跨日線時,程式就不會畫經線(負值經度卻必須出現在東方),這對東亞地區的模擬結果展現是一項難題。
    • 官網只有下列用法示範
ax.gridlines() #完全使用程式內設型態(黑色實線、無標籤)
ax.gridlines(color="black", linestyle="dotted") #黑點線
ax_ctt.gridlines(color="white", linestyle="dotted")#白點線
  • 如果改成matplotlib.pyplot.grid,因為metplotlib並不會解讀wrf-python的地圖底圖,給定的是垂直格線,沒有太多資訊。而且會影響圖面的精密度,降低圖面的品質,建議不要混用。
  • 經探討wrf-python的程式碼,發現gridlines還有很多的設定方式。說明如下

wrf-python-notebooks

  • github網友 Clark Evans(2021)提供了gridlines的8個設定參數

出處

有關gridlines的程式碼

import matplotlib.ticker as mticker
from cartopy.mpl.gridliner import LONGITUDE_FORMATTER, LATITUDE_FORMATTER

# Add latitude/longitude gridlines.
# The first line sets up basic gridline parameters - grey dotted lines with labels.
# The next two lines suppress drawing labels on the top and right sides of the plot,
#    making the plot's labels consistent with typical map conventions.
# The next two lines specify how frequently to draw gridlines - here, every
#    5 deg lat/lon. It may be best to comment these two lines out the first
#    time you run the code to see the plot's overall extent, then determine
#    how frequently you wish to draw the gridlines in each direction.
# The next two lines control aspects of labeling the gridlines, here their
#    font size and text color.
# Lastly, the final two lines format the gridline numbers in deg N/S/E/W format.
# More information: https://scitools.org.uk/cartopy/docs/latest/matplotlib/gridliner.html
gridlines = ax.gridlines(color="grey", linestyle="dotted", draw_labels=True)
gridlines.xlabels_top = False
gridlines.ylabels_right = False
gridlines.xlocator = mticker.FixedLocator(np.arange(-90.,-55.,5.))
gridlines.ylocator = mticker.FixedLocator(np.arange(15.,45.,5.))
gridlines.xlabel_style = {'size':12, 'color':'black'}
gridlines.ylabel_style = {'size':12, 'color':'black'}
gridlines.xformatter = LONGITUDE_FORMATTER
gridlines.yformatter = LATITUDE_FORMATTER

原結果圖形

實測結果(過期警告)

  • 雖然是2010年的筆記,但有關經緯度標籤的開啟選項已經改成上下左右_labels(.bottom_labels.left_labels)。
  • 所以相關設定不會起作用
The .xlabels_top attribute is deprecated. Please use .top_labels to toggle visibility instead.

知乎網友貢獻

  • 該篇文章除了提供gridlines最新的用法之外,還引用了標籤的字型、
from cartopy.mpl.gridliner import LONGITUDE_FORMATTER, LATITUDE_FORMATTER
Times = FontProperties(fname="./font/Times.ttf")
gl.xlocator = mticker.FixedLocator(np.arange(118, 123.1, 0.5))
gl.ylocator = mticker.FixedLocator(np.arange(28, 33.1, 0.5))
gl.xformatter = LONGITUDE_FORMATTER
gl.yformatter = LATITUDE_FORMATTER
gl.xlabel_style = {'size': 12, "color": 'k', "font": Times}
gl.ylabel_style = {'size': 12, 'color': 'k', "font": Times}
  • 也直接按照cartopy.mpl.gridliner的內容修改成類似GrAds的坐標軸樣貌,這些指令與前述gridlines設定參數可以融合。
from cartopy.mpl.ticker import LongitudeFormatter, LatitudeFormatter
gl.top_labels,gl.bottom_labels,gl.right_labels,gl.left_labels = False,False,False,False
gl.xlocator = mticker.FixedLocator(np.arange(118, 123.1, 0.5))
gl.ylocator = mticker.FixedLocator(np.arange(28, 33.1, 0.5))
axe.set_xticks(np.arange(118,123.1, 0.5), crs=ccrs.PlateCarree())
axe.set_yticks(np.arange(28,33.1, 0.5), crs=ccrs.PlateCarree())
axe.xaxis.set_major_formatter(LongitudeFormatter())
axe.yaxis.set_major_formatter(LatitudeFormatter())
axe.set_xticks(np.arange(118, 123, 0.1), crs=ccrs.PlateCarree(), minor=True)
axe.set_yticks(np.arange(28, 33, 0.1), crs=ccrs.PlateCarree(), minor=True)
axe.tick_params(labelcolor='k',length=2)
labels = axe.get_xticklabels() + axe.get_yticklabels()
[label.set_fontproperties(FontProperties(fname="./font/Times.ttf",size=8)) for label in labels]

知乎出處

原圖結果

評論

  • 基本上、經緯度座標軸的需求大多以氣象要素為展示的主體,並沒有必要一定需要是等距離、垂直網格的系統,與空氣品質濃度分布的需求不同。而且範圍越大,此2系統的差異越大。
    • 有關cartopy的投影設定,可以參考官網說明。

其他gridlines設定

指定繪出特定的經緯度線xlocs、ylocs

  • GeoAxes.gridlines(ax, xlocs=meridians, ylocs=parallels)
  • meridiansparallels為經緯度序列

指定範圍

  • gl = ax.gridlines(xlim=xlim, ylim=ylim)
  • xlimylim為序列,分別為最小與最大值

line config

  • 顏色:color='blue'
  • 線條型態:linestyle='-':虛線
  • 線條透明度:alpha=0.5
  • 線寬:linewidth=1.5

有關標籤標示

  • 是否自動寫在線上auto_inline=True
  • 是否按照經緯線旋轉:rotate_labels=False
  • 是否切斷:clip_on=True

指定xlocs後之圖形

因範圍內有跨日線gridlines()無法畫出經線xlocs=np.arange(70,180,10)